Which scenario has the lower carbon footprint: a few tourists spending a lot, or many tourists spending a little? Is it the small group of luxury tourists who eat steak dinners, stay in high-end lodges, and fly around in helicopters? Or the much larger group of budget-conscious tourists who eat beans on toast, stay at the local backpackers, and catch the bus?
This was the central question of a recent report on sustainable tourism by thinkstep-anz. The report was commissioned by the Parliamentary Commissioner for the Environment as part of his broader work programme for Not 100% – but four steps closer to sustainable tourism. The answer to this question is important given that the New Zealand tourism industry has an opportunity to reinvent itself in the post COVID-19 world – a sentiment echoed by Lonely Planet founder Tony Wheeler in a recent interview with NZ Herald.
Tourism New Zealand has aimed for a ‘value over volume’ strategy in international tourism for the past 20 years, according to its former chief executive George Hickton in Tourism Ticker. But is this still a valid strategy post-pandemic?
We used credit card spending per day as a proxy for the tourist’s ‘value’ to the New Zealand economy
Our analysis looked at credit card spending within New Zealand by international tourists, split by how much money the tourist spent each day and where they spent that money. We defined the ‘value class’ of tourists by the amount they spent each day — from lower-value budget tourists to much higher-value luxury tourists. Their carbon footprint was determined by their spending categories, such as restaurants, accommodation, and rental cars.
We then combined this data with international aviation emissions data for each visitor’s country to create carbon footprint profiles per country and per value class. For example, luxury tourists from Australia, and mid-class tourists from Germany.
High value tourism has a lower carbon footprint than high volume tourism for New Zealand
We found that high spending tourists have a higher carbon footprint per trip to New Zealand due to a combination of premium airfares and higher levels of spending (FIGURE 1).
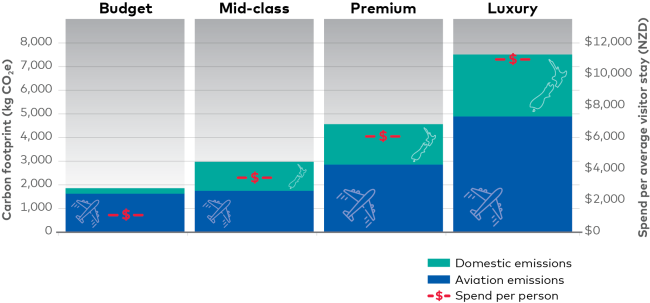
FIGURE 1: Absolute carbon footprint and spend per average international visitor stay
However, it is precisely these higher levels of spending (the red dollar signs in FIGURE 1) that contribute to a lower carbon footprint per dollar spent in the New Zealand economy (FIGURE 2).
The ‘value over volume’ strategy is, therefore, appropriate to minimise the carbon footprint of tourism to New Zealand. Per dollar spent within the New Zealand economy, the lowest carbon footprint would be achieved by a smaller number of high-spending tourists. While a larger number of lower-spending tourists could contribute to the same level of spending, doing so would come at a higher overall carbon footprint.
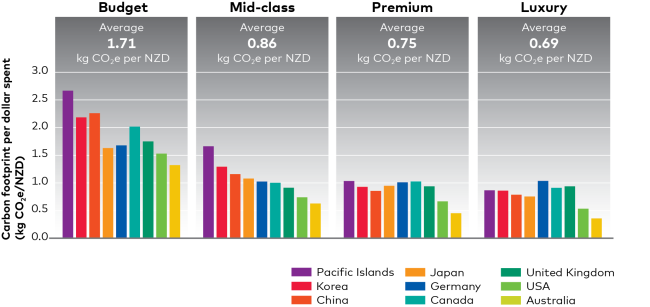
FIGURE 2: Carbon footprint per dollar spent, by visitor segment and region
International aviation makes up more than half of the carbon footprint of tourism across all spending categories we considered in this analysis (FIGURE 1). While it is undoubtedly necessary to get tourists here in the first place, the carbon footprint of aviation is very high for every dollar they contribute to the New Zealand economy.
We found that once in New Zealand, the main contributors to the carbon footprint of international tourists are:
- fuel burnt in rental and private vehicles
- food and beverages
- accommodation
- shopping (clothing and durable goods).
Encouraging tourists from Asia/Pacific, longer-terms stays, and uptake of electric vehicles are all important steps to decarbonise tourism
While we can’t change the fact that most tourists need to fly to get to New Zealand, there are several proactive steps we can take:
- Encouraging tourists to stay longer in the country, rather than encouraging many high-value, short-term tourists.
- Targeted marketing of New Zealand to help reduce aviation emissions, focusing on:
o our closer neighbours in Australia, the Pacific, and Asia
o countries whose residents typically choose to stay longer in New Zealand (e.g. German tourists).
- Decarbonising domestic tourism once visitors arrive, particularly transitioning New Zealand’s rental car fleet and private vehicle fleet to electric vehicles or other lower-carbon technologies.
Our analysis is a start, not the final word
Our analysis is intended as a conversation starter, not the final word on the topic of low-carbon tourism. It builds on earlier work, and we expect more work to follow.
Our analysis has several important limitations:
- Its focus is on carbon footprint only, not other environmental or social impacts of tourism.
- It considers only total monetary flows through the New Zealand economy, and not the distribution of this money throughout New Zealand. While high-value spending may help to support New Zealand’s luxury operators, it is very likely that lower-value tourists contribute disproportionately to regional New Zealand in ways that are not adequately captured by total dollar flows through the economy.
- Our approach is a simplification of reality because of the limited availability of data. We used credit card spending per day as a proxy for tourist’s value. And we assume that higher-value tourists typically fly first or business class rather than economy class. Furthermore, the effect of premium products within the same class of merchants could not be considered (for example, luxury hotels versus budget hotels). This is because credit card data can only be broken down into spending categories by business category (restaurant, hotel, etc.).
Report authors: Christin Schaller and Jeff Vickers
Published on: October 2020