 |
 |
Minister Andrew Bayly launched a new MBIE report showing circular opportunities for manufacturing
The report Mapping Emissions and Waste Stream Profiles, and Opportunities for Achieving Net-Zero Circular Advanced Manufacturing supports the growth and resilience of Aotearoa New Zealand’s advanced manufacturing sector. It shows that circular economy models can reduce supply risks and global emissions, create skilled jobs, and make businesses more resilient.
New Zealand’s minister for small business and manufacturing, Andrew Bayly, launched the report on 29 July 2024 in Auckland. "If we do not reduce our emissions and map them, it's going to be harder for New Zealand manufacturers to export around the world. It's vital that we support manufacturers to do just that," he said at the launch.
Bayly emphasised the Government's goals of growing the economy and reducing greenhouse emissions. "We must grow the economy and supporting businesses to thrive is a key component of that." He also noted the importance of the manufacturing sector, which "accounts for 10% of the economy and 60% of all our exports."
Andrew Hume, General Manager the Ministry of Business Innovation and Employment (MBIE) noted: ‘This Report and dataset are the latest editions to a fantastic suite of research papers that MBIE have commissioned over the past couple of years to support Aotearoa New Zealand to transition to a more circular economy and sustainable bioeconomy.
‘Together this work went over and above what we commissioned. I would like to thank Kelly McClean (Aurecon), Jim Goddin (thinkstep-anz) and James Griffin (Sustainable Business Network), along with your respective teams, for all your hard work. You make a great team and have been a pleasure to work with’.
thinkstep-anz partnered with Aurecon and the Sustainable Business Network to deliver this report for MBIE. The summary report was designed by our Creative team.
 The goals were to:
→ Identify and map the sector’s emissions and waste patterns.
→ Find ways to adopt net-zero circular manufacturing practices within and across subsectors. This strategy supports work underway on New Zealand’s Emissions Reduction Plans and Te Rautaki Para Waste Strategy.
Advanced manufacturing makes up 10% of the economy ($24.1 billion GDP).
We used quantitative and qualitative methods to map emissions and waste across the advanced manufacturing sector and its seven subsectors, using data from 2019 (the last pre-Covid year with robust data).
A combination of ‘top-down’ and ‘bottom-up’ approaches provided broad and detailed views of the current state of New Zealand’s advanced manufacturing subsectors and potential opportunities. The project combined desktop research, stakeholder engagement, and reporting.
Net-zero practices aim to eliminate carbon emissions by cutting them entirely or reducing them to the point where the remaining emissions can be offset. These emissions typically stem from the energy we use and products we consume.
The circular economy seeks to decouple the economic value of goods and services from the impacts of extraction and waste production by designing out waste, keeping assets and materials at their highest value and regenerating nature. The circular economy is closely linked to the Bioeconomy, which uses renewable biological resources to produce food, products, and energy.
Key findings
→ Circular economy practices exist in New Zealand within and across manufacturing subsectors. Subsectors differ greatly. However, they are connected through resource flows and face similar challenges, particularly around waste.
→ Of 17,288 kt of waste generated, 92% ended up in landfill, and 8% was recycled or exported.
→ Total consumption-based emissions were 24,900 ktCO2e, and production-based emissions were 12,900 ktCO2e. This means that we are importing about half of our total emissions embodied in products that we are importing.
→ Features of New Zealand’s national and regional economies, import and export dependencies and manufacturing sector influence opportunities for change, the barriers that limit change and the enablers that support it.

Figure 1. Main manufacturing subsectors and manufacturing GDP share (2020)
Opportunities
There are opportunities for each subsector to adopt net-zero practices, such as decarbonising process heat decarbonisation, product stewardship, and using recycled materials. The report also emphasises the importance of design for reduction, recycling, and reuse.
Barriers and Enablers
Key barriers include access to capital, competition for funding within organisations, lack of familiarity with circular business models, and insufficient access to necessary supply chains.
Enablers include cross-sector and regional collaboration, accessible funding, government policies and regulations, national circularity targets, and enhanced waste data gathering by the Ministry for the Environment
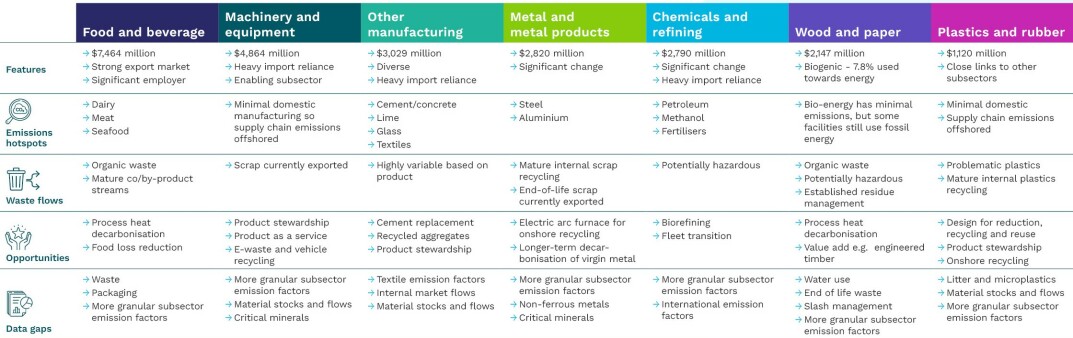
Figure 2. Main manufacturing subsectors and manufacturing GDP share (2020)
Data Gaps
The report identifies several data gaps, including more granular subsector emission factors, material stocks and flows, critical minerals, and international emission factors. It recommends continued development and updating of data in collaboration with the industry.
Recommendations
→ Work with industry to identify and realise opportunities for a decarbonised circular manufacturing sector
→ Support the adoption of digital tools for data collection and communication
→ Investigate ways to extend the lifespan of assets and improve recycling processes
→ Address data gaps and enhance understanding of resource flows and emissions
Conclusion
The report concludes that while circular economy practices are present, they face challenges. More work is needed to overcome barriers and leverage enablers to achieve net-zero circular advanced manufacturing in New Zealand. Collaboration and support for data transparency are crucial.
Circular economy models can reduce supply risks and global emissions, create skilled jobs, and make businesses more resilient. However, clear policies are needed to manage the transition from global to domestic emissions.
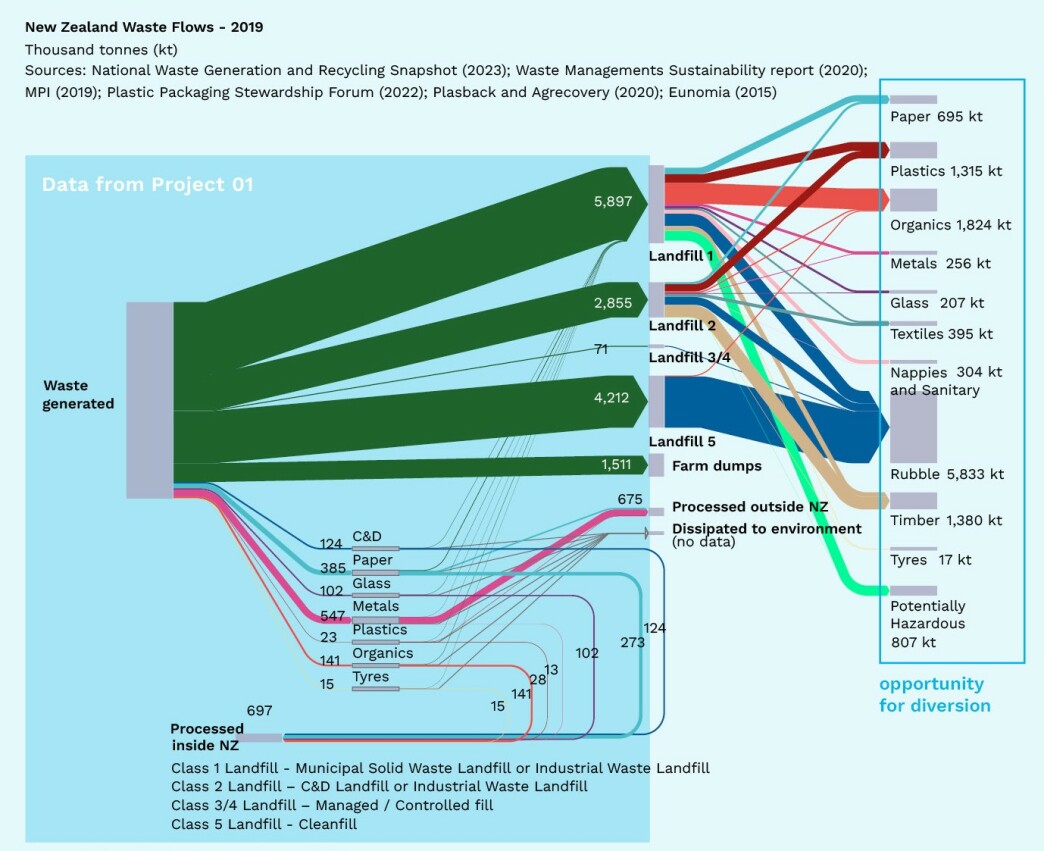
Figure 3. New Zealand waste flows (2019)
To read the full 208-page report, head to the MBIE website with the link below: